

MSFT: Ctrl+Alt+Buy
S Tier business and it's a buy at $464.

My Take Up Front
Microsoft scored 72, A Tier but the numbers with context tell me it’s an S Tier business. See the final score section for the reasons.
Also, it’s a buy at $464 with potential double-digit returns. Check the valuation section at the end.
Before we run through the checklist and valuation, here is a mental model for Microsoft so you have a better understanding of the business: 50-30-15.
Think of Microsoft as having three engines. About half of the business is Azure and cloud services, which power businesses behind the scenes. About one third comes from Microsoft Office, including Microsoft 365, Teams, Outlook, and LinkedIn. The remaining about one fifth comes from Windows and Xbox, including Windows licenses, gaming, Surface devices, Bing, and Edge.
Now, let’s go through each step in detail.
Make sure to LIKE OR RESTACK. Means a lot to me.
Step 1. Historical Returns: how has the stock done, and how steadily?
Great over a decade. Messy over the last two years.
The bar: a timeframe passes when the stock compounded at 10% or better AND the price line hugs its trend with an R² of 0.85 or higher. Six timeframes get checked. All six passing is a 10. Five is an 8. Four gets a 6.
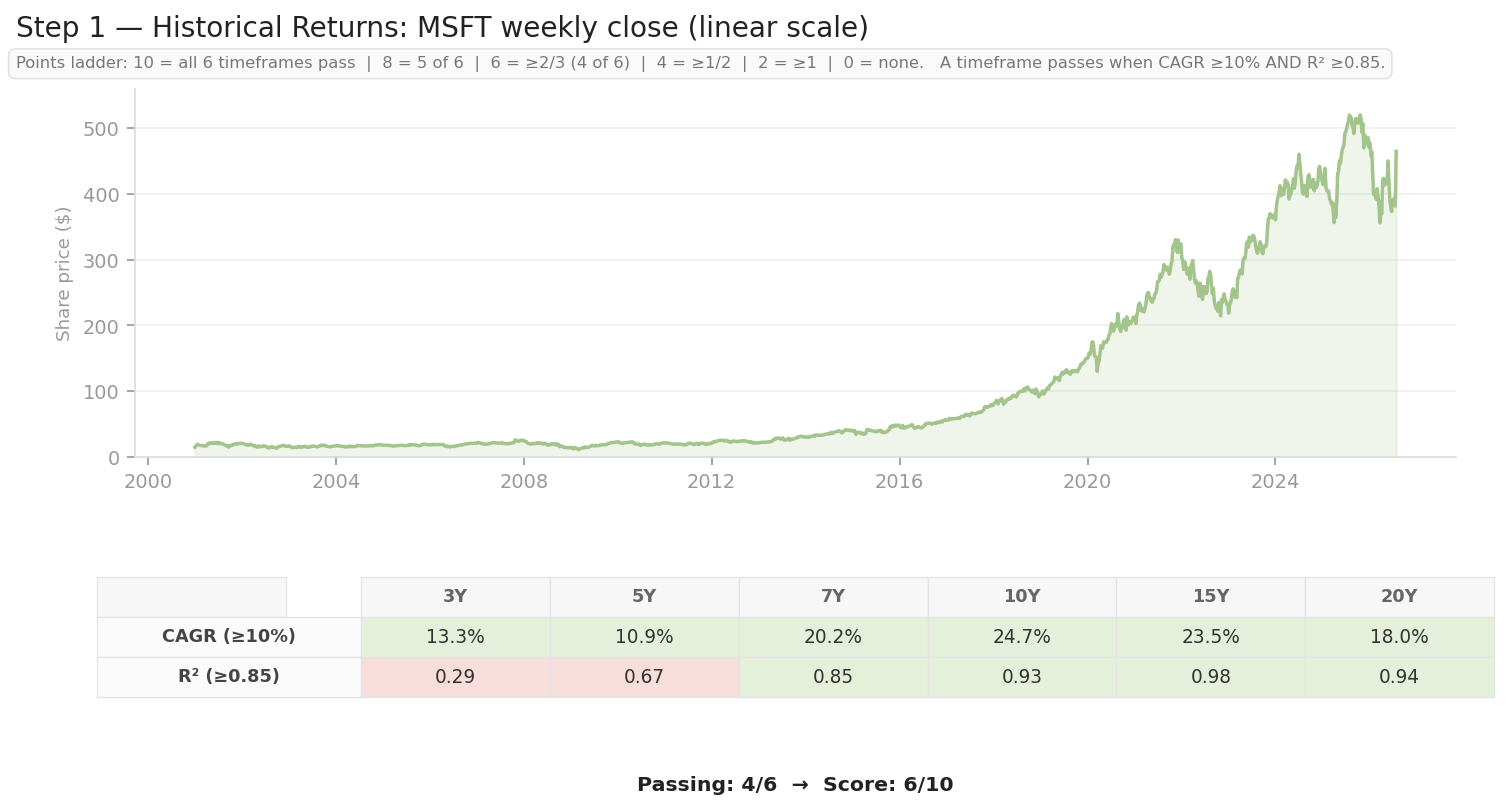
Every single timeframe cleared the 10% CAGR test. The 20Y is 18.0% and the 10Y is 24.7%. Then the R² row falls over at the short end. 0.29 at three years. 0.67 at five.
Rsq is my steadiness check. It asks whether the price went up in something resembling a line. The stock hit $520, dropped to $390 by the end of June, and sat at $464.
Four of six pass. 6/10.
The market has paid up for this business for twenty years. Recently it stopped. Let’s look under the hood and find out whether that’s the business or the multiple.
Step 2. Historical Growth: is the business actually growing?
Revenue and earnings, yes. Cash, no.
The bar: three metrics tested across six timeframes for eighteen checks total. Revenue needs a 7% CAGR. EPS and FCF each need 10%. Eighteen out of eighteen is a 10. Sixteen or seventeen is an 8. Twelve gets a 6.
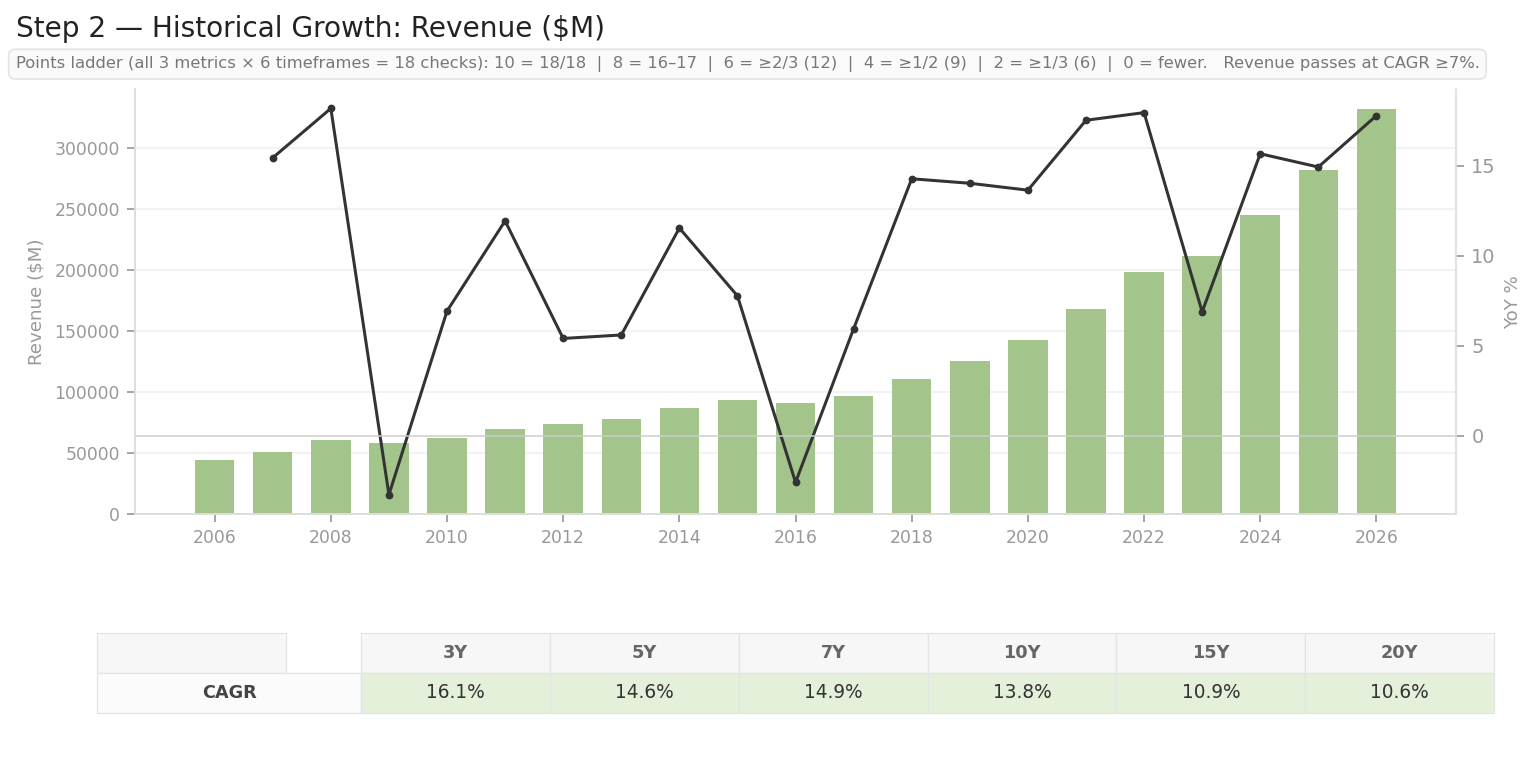
Revenue passed all six. The 20Y CAGR is 10.6% and the 3Y is 16.1%. A company doing $332B in annual revenue accelerating into its fifth decade is a genuinely odd thing to see. A monster at a monstrous scale.
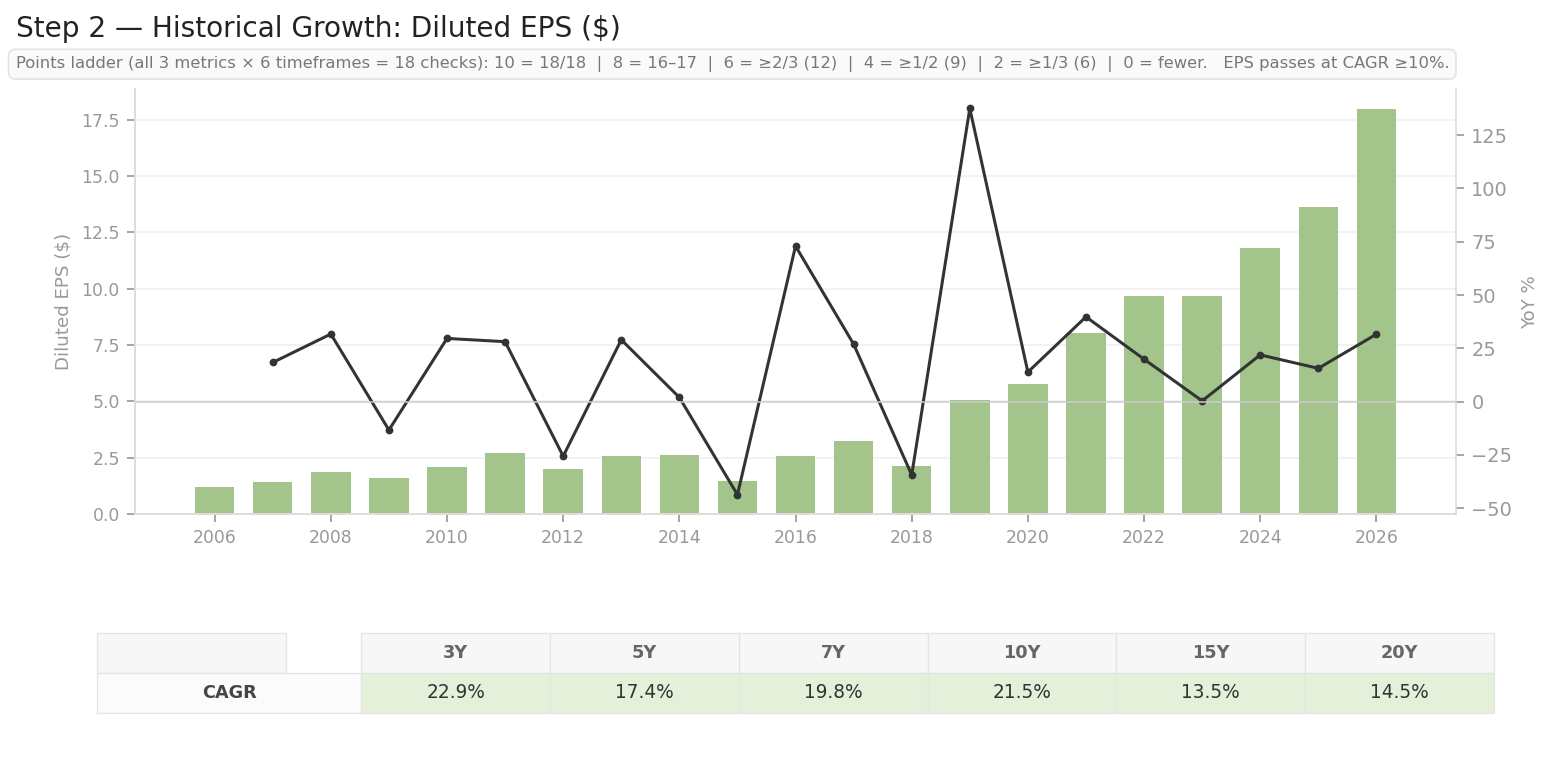
EPS passed all six too. 14.5% over twenty years, 22.9% over three. Two dips are worth explaining because they distort the shorter windows if you start the clock in the wrong year. FY2015 EPS fell to $1.48 on a $7.5B impairment of the Phone Hardware business, of which $5.1B was goodwill and $2.2B was intangibles. FY2018 fell to $2.13 because of a $13.7B net charge from the Tax Cuts and Jobs Act, which knocked $1.75 off diluted EPS by itself.
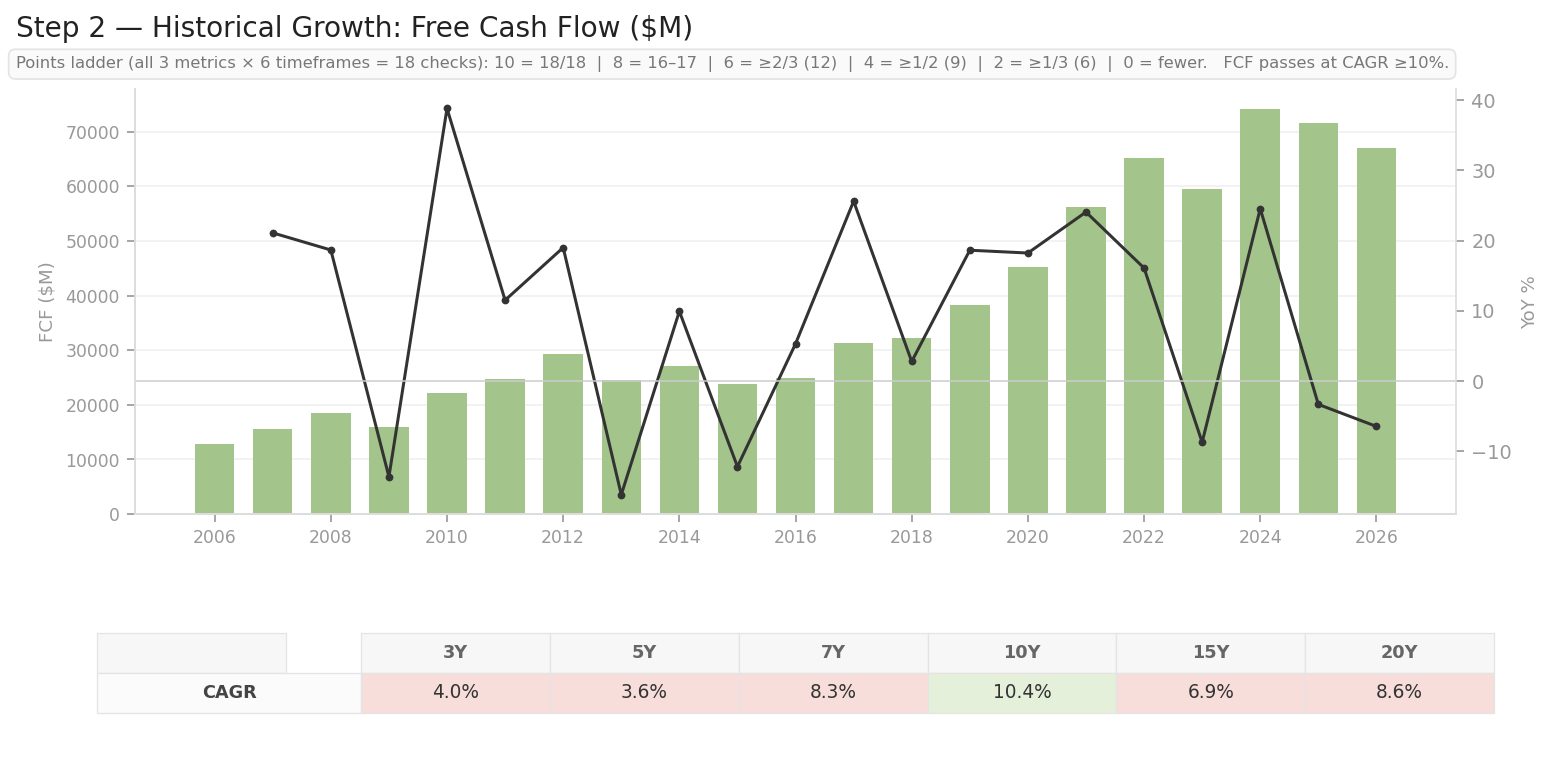
And then free cash flow. One out of six.
3Y at 4.0%. 5Y at 3.6%. FCF was $65.1B in FY2022 and $67.0B in FY2026. Four years of essentially flat cash while revenue went from $198B to $332B.
Capital expenditure went from $28.1B in FY2023 to $44.5B, then $64.6B, then $115.9B in FY2026. It quadrupled in three years. Microsoft is building AI datacentres, and every dollar of that spending lands between operating cash flow and free cash flow.
Thirteen of eighteen checks pass. 6/10.
Step 3. FCF / Net Income: is that growth real cash or just accounting?
Half of it is showing up as cash. This is the category that breaks the score.
The bar works in levels. Take the median FCF/NI ratio in each of the six timeframes. Every median at 100% or better is a 10. All of them at 90% is an 8. All at 80% is a 6. If only two thirds clear 80%, you get a 4.
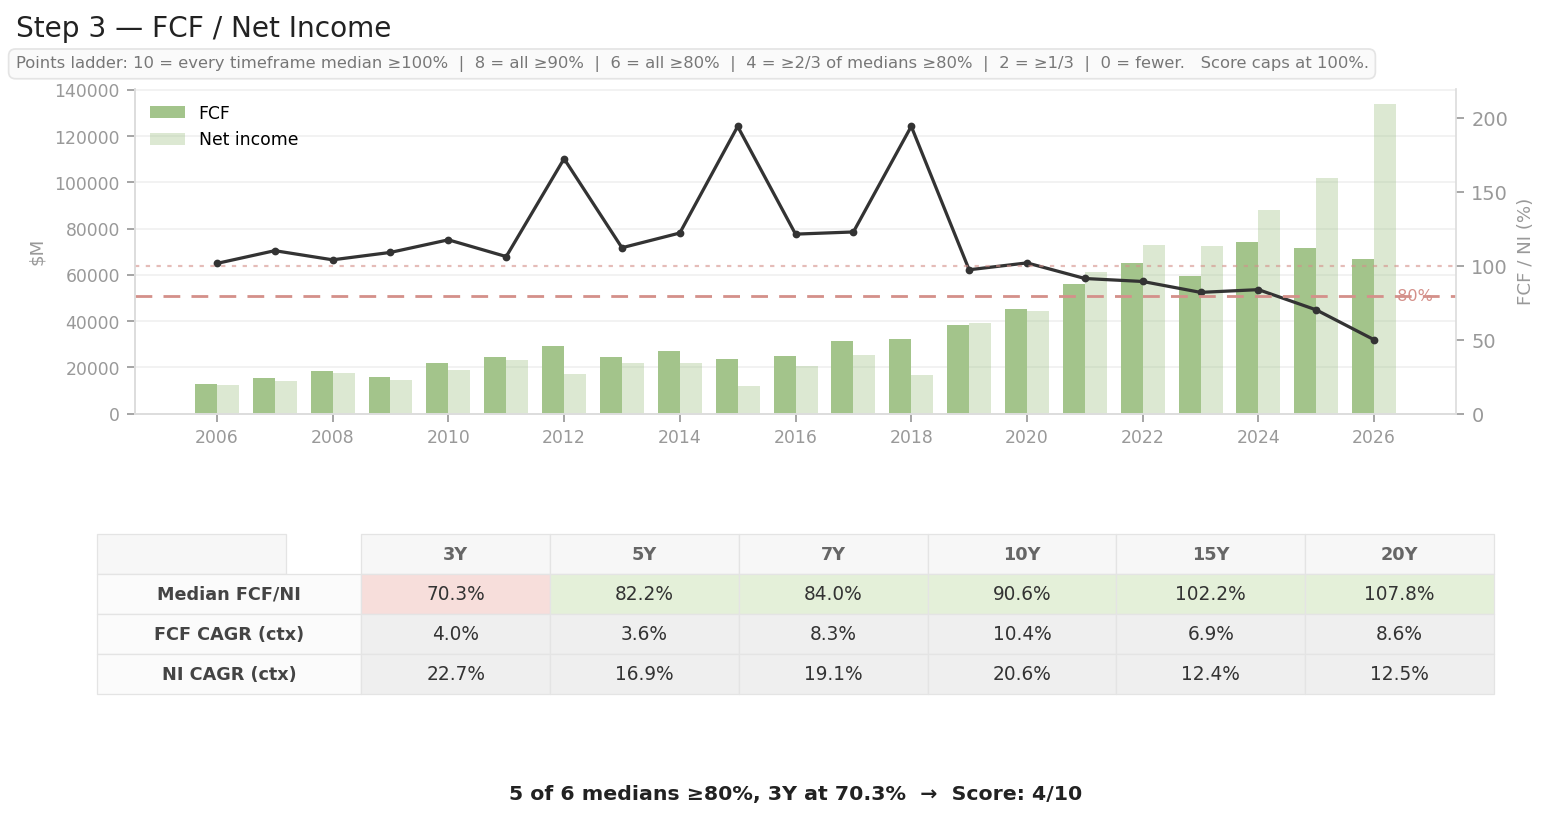
FY2026 FCF/NI came in at 50.1%. The year before it was 70.3%. Before that, 84.0%.
Five of six medians clear 80%. The 3Y sits at 70.3%. 4/10.
Growth rates for absolute values would be less useful if the shareholders are being diluted. So, let’s checkteh share count.
Step 4. Share Count: is management buying back stock or diluting me?
Buying back. Slowly.
The bar: four windows, 3Y through 10Y. Shares shrinking by 3% a year or more across all four is a 10. Shrinking by 1% or more is an 8. Stable or shrinking, meaning anything at or under +1% a year, is a 6.
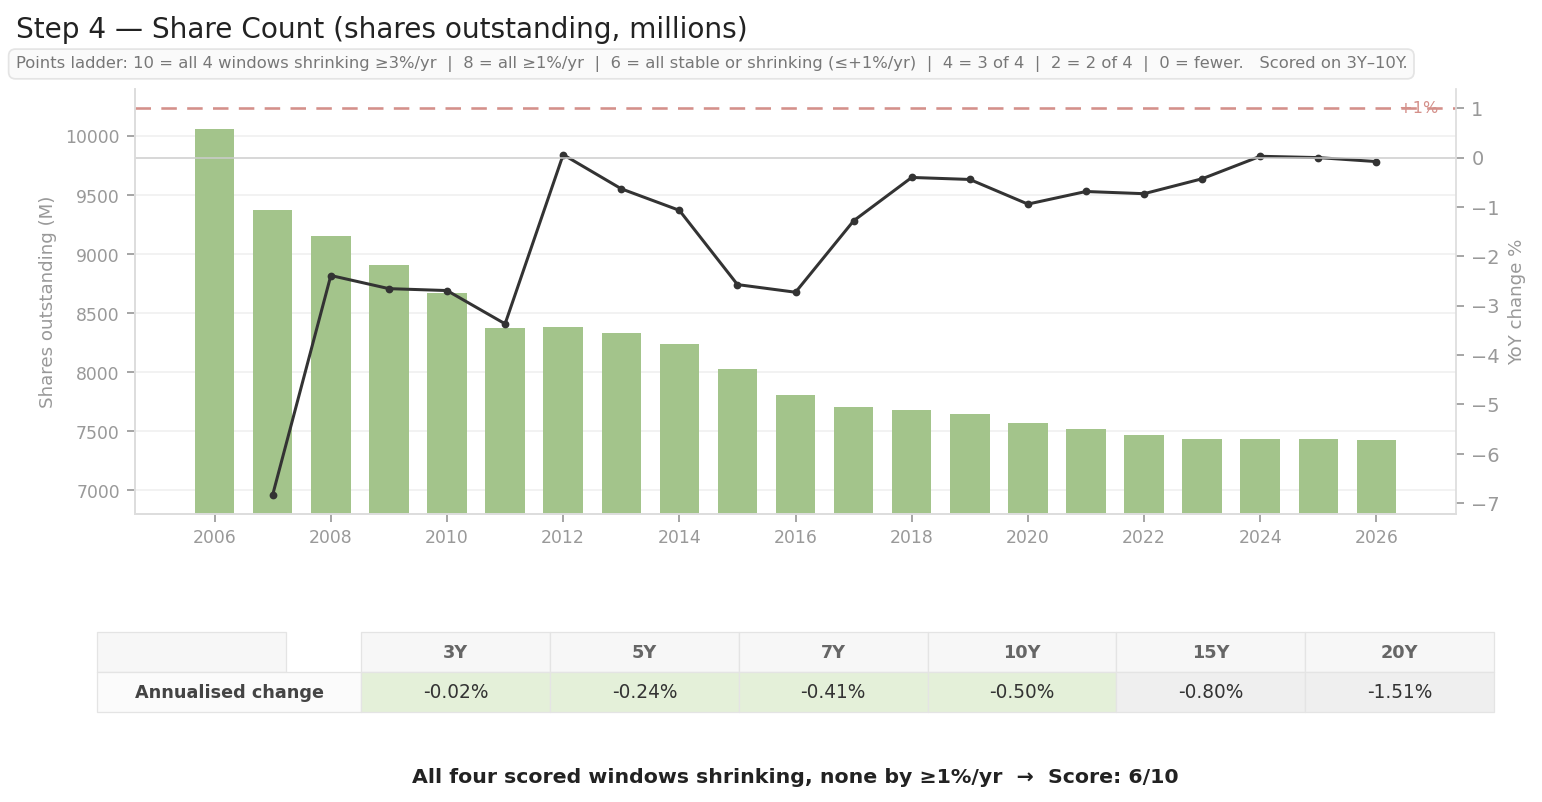
Shares outstanding went from 7,808M ten years ago to 7,428M now. That’s 0.50% a year. Over three years it’s 0.02% a year, which is a rounding error away from flat.
All four windows stable or shrinking, none of them by 1%. 6/10.
The 20Y figure is 1.51% a year. Microsoft used to retire a lot more stock than it does now.
Microsoft retired 95 million shares in fiscal 2022 at an average price around $295. In fiscal 2026 they retired roughly 35 million at about $477. The dollars did fall, from $28 billion of program buybacks down to something near $17 billion, because capex hit $115.9 billion last year and the dividend now takes $26.4 billion a year regardless of what else is going on. Price did most of the damage though. When the stock triples, a buyback dollar retires a third of the float it used to and the $12.4 billion of stock comp didn’t help. That flat line since 2022 is what a big buyback looks like when your stock goes up faster than your buyback.
Step 5. Margins: is the business getting better or worse?
Better on two of the three. Worse on the one that’s under pressure everywhere else in this post.
The bar: three margins compared across five windows against their own 20Y median for fifteen checks. A window passes if its median sits within 100bps of the long-run median or above it. Fifteen out of fifteen is a 10. Thirteen or fourteen is an 8.
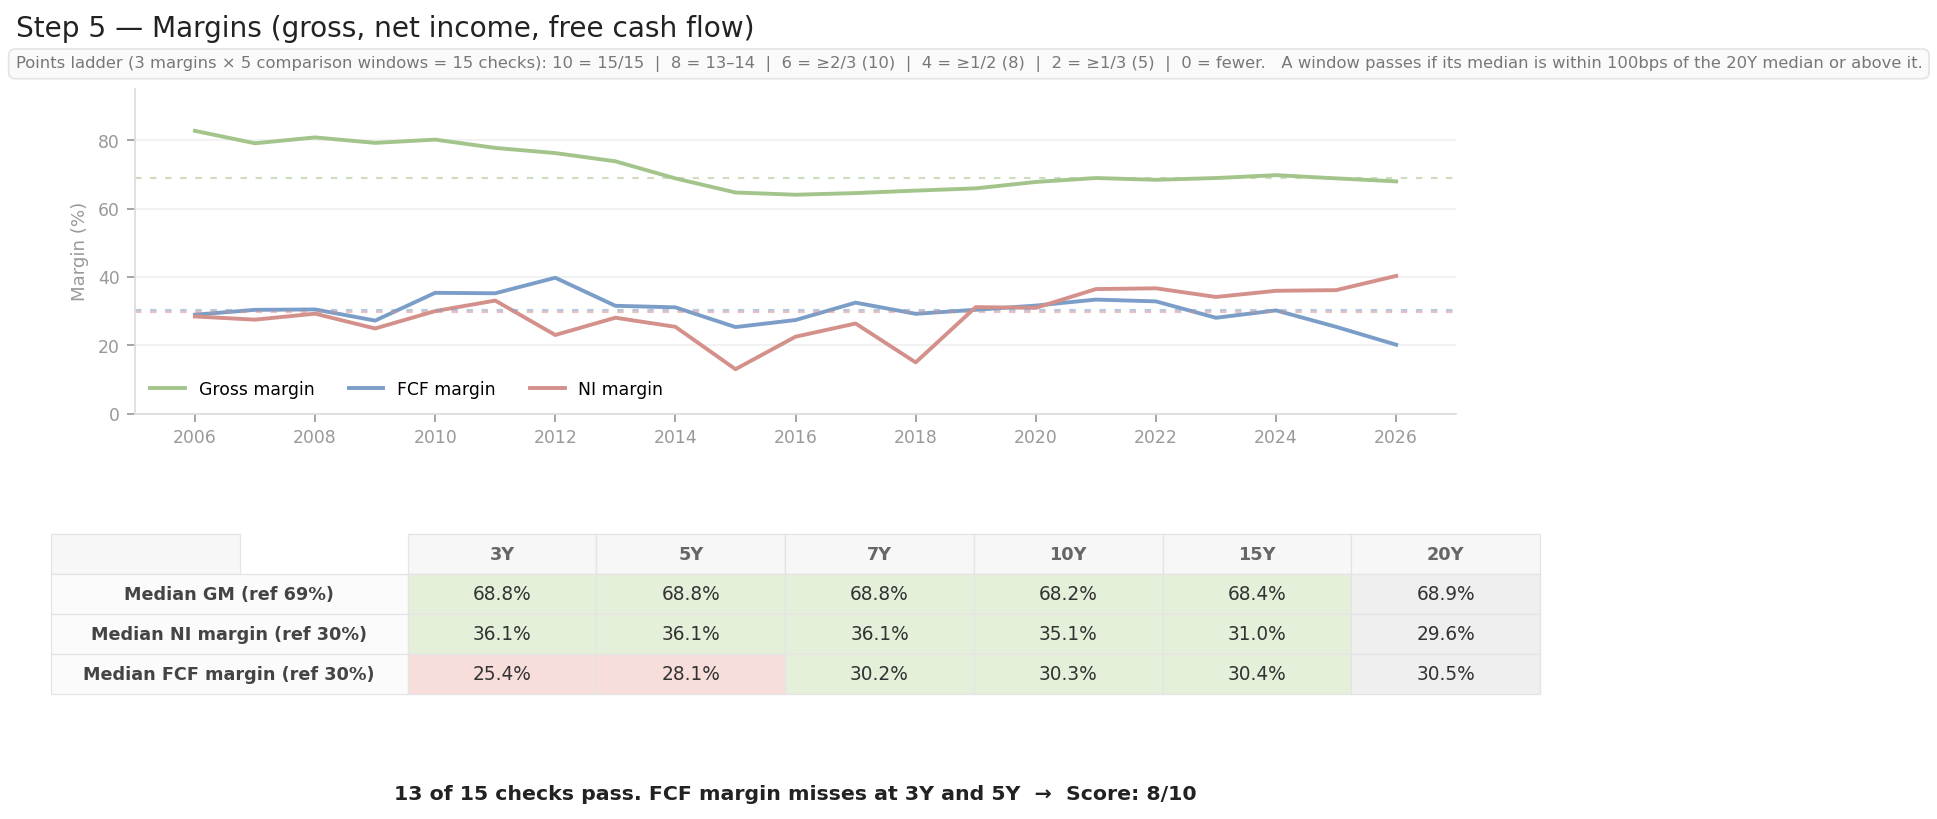
Gross margin passed all five and sits at 68.8% against a 68.9% reference. Flat as a table for a decade.
Net income margin passed all five by a mile. The 3Y median is 36.1% against a 20Y reference of 29.6%. FY2026 printed 40.3%.
FCF margin failed at 3Y and 5Y. The 3Y median is 25.4% against a 30.5% reference, which is 503bps of contraction. Same story as step 3, showing up in a different place.
Thirteen of fifteen. 8/10.
Step 6. Moat: can anyone else do this?
No. This is the best category in the report and it isn’t close.
The bar: median gross margin of 60% or better AND median ROIC of 25% or better gets a 10, so long as the current year hasn’t fallen more than 200bps below those medians. 50% and 20% is an 8. 40% and 15% is a 6.
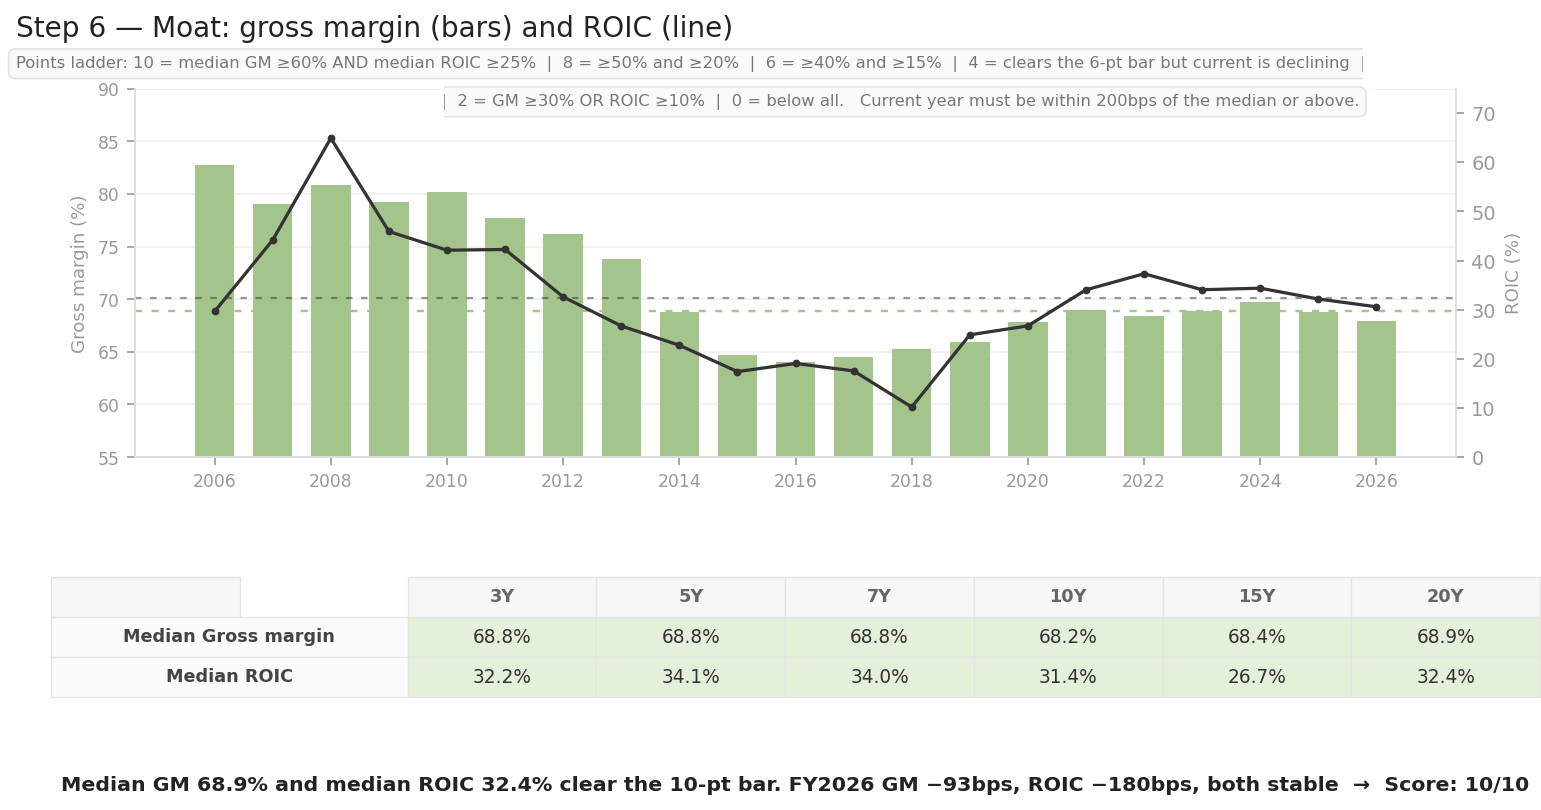
The median gross margin over twenty years is 68.9%. Median ROIC is 32.4%. Both clear the top bar with room.
The trend gate is what I actually worried about here, because capex should be crushing returns on capital. FY2026 gross margin came in at 67.9%, which is 93bps under the median. ROIC came in at 30.6%, which is 180bps under. Both inside the 200bps band. Both stable.
10/10.
One dip on that ROIC line needs explaining before someone emails me about it. FY2018 shows 10.2%, the worst reading in the series. FY2018’s effective rate was 54.57% because of the $13.7B Tax Cuts and Jobs Act charge. Operating income that year was $35.1B and rising. The business was fine.
Step 7. Management: is capital being allocated well?
Yes, and this is the category I went back and forth on the longest.
The bar: median ROE of 30% or better AND median ROIC of 25% or better is a 10. 25% and 20% is an 8. 20% and 15% is a 6. If the medians clear the bar but the current year has fallen more than 200bps below them, the score drops to a 4.
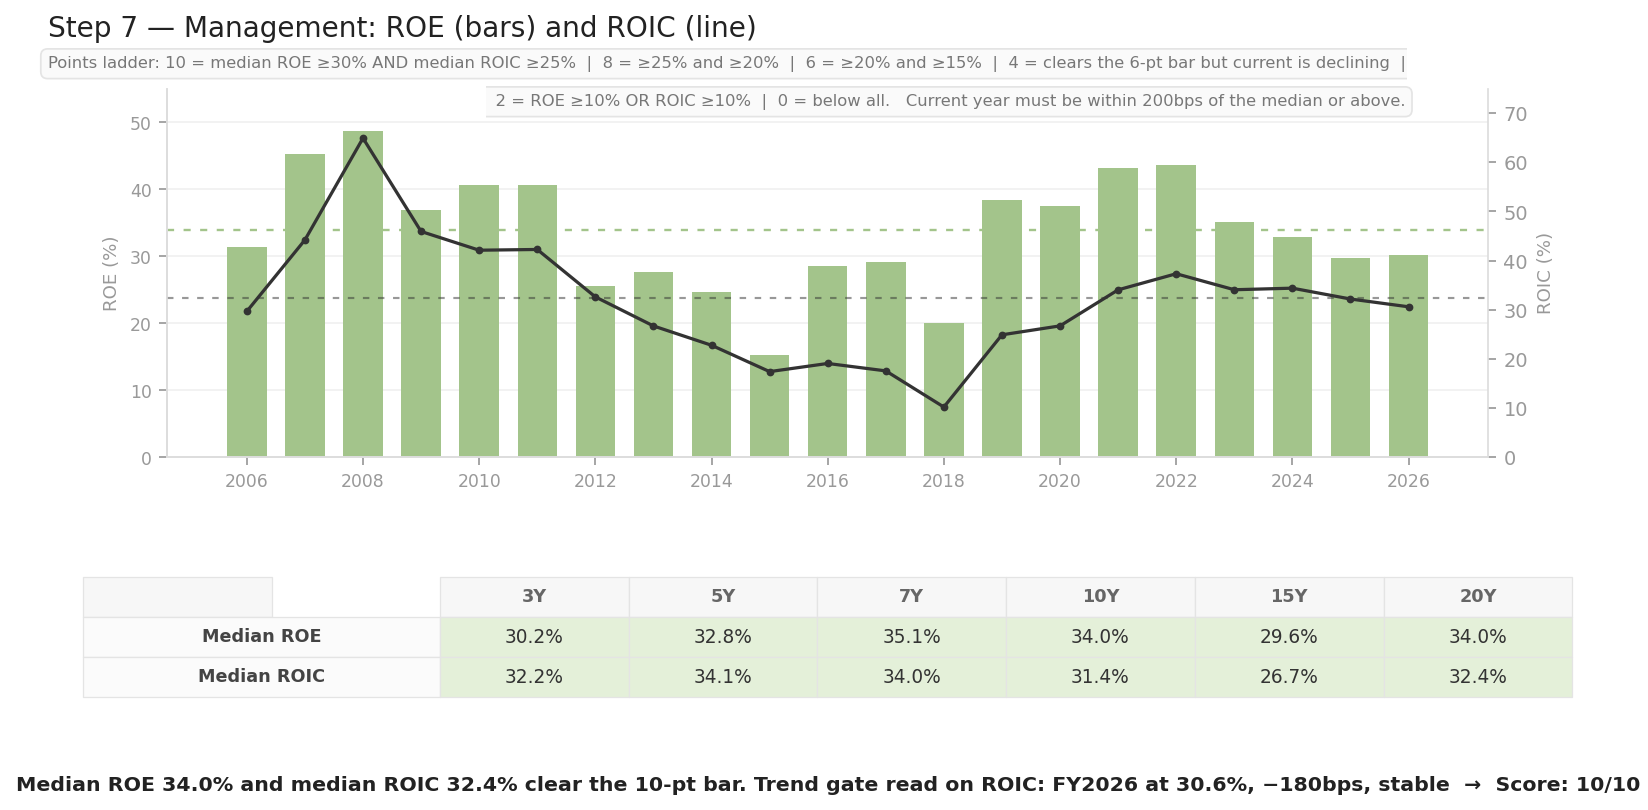
Median ROE over twenty years is 34.0%. Median ROIC is 32.4%. Both sail past the 10-point thresholds.
10/10.
Step 8. Balance Sheet: can it survive a storm?
Easily. Next question.
The bar: interest coverage of 25x or better AND net debt to EBITDA under 1x is a 10. 20x and 2x is an 8. 15x and 3x is a 6. Both the long-run median and the current year have to clear, and the score is the lower of the two.
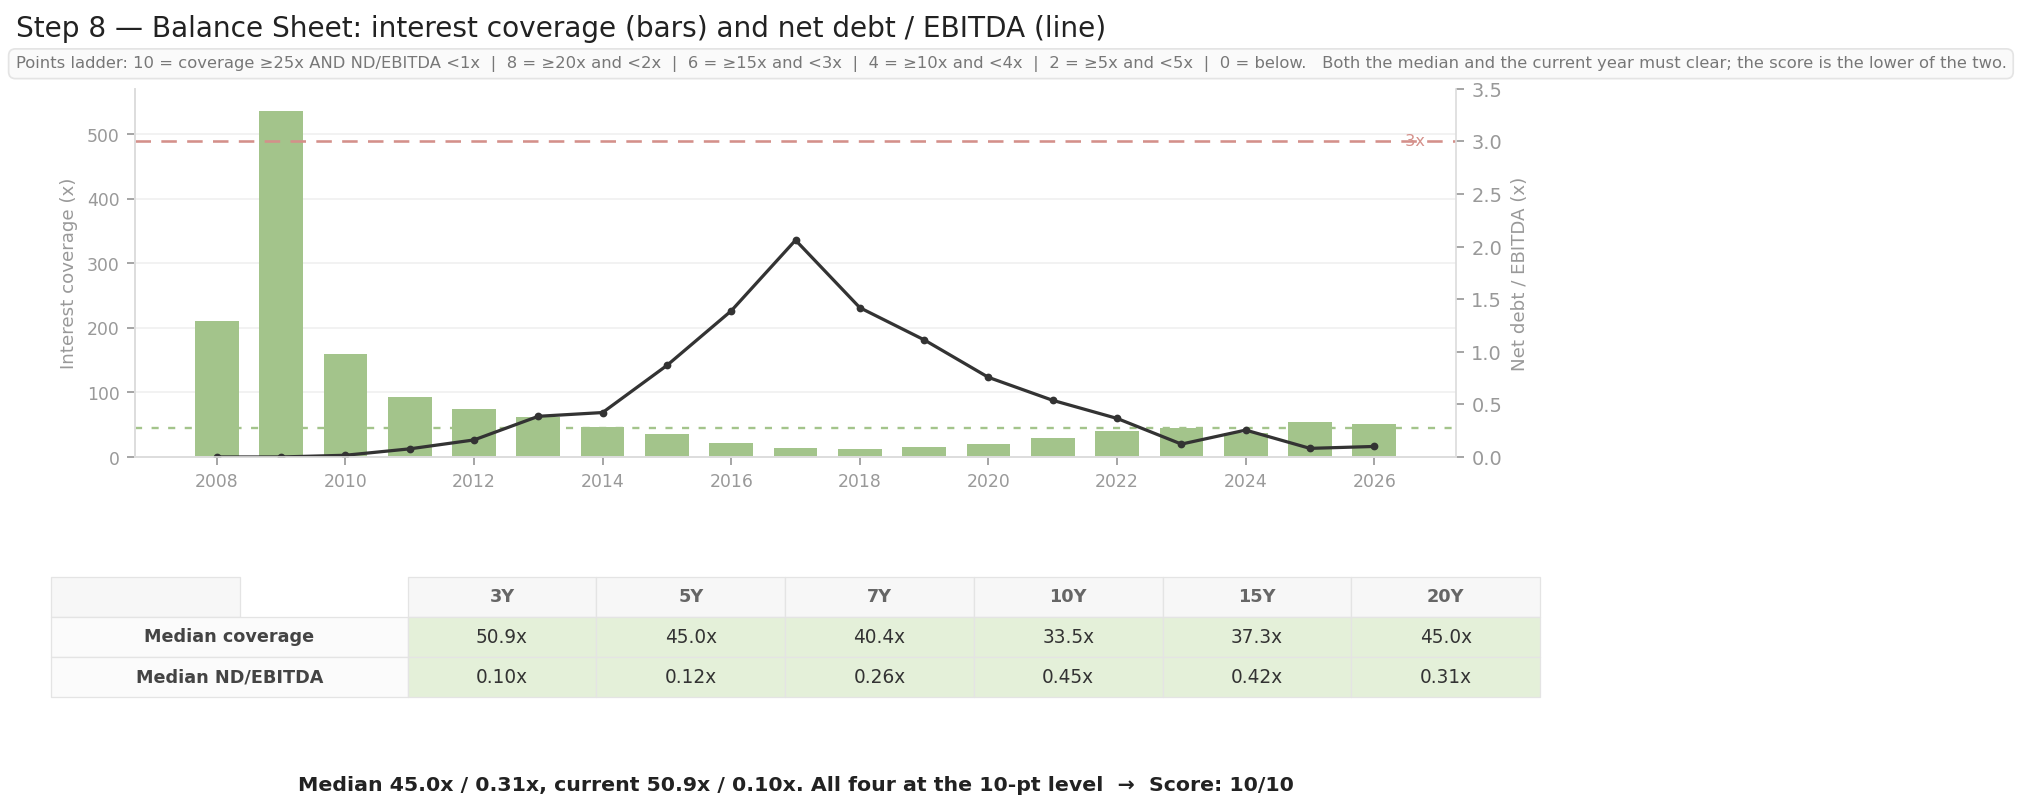
Median interest coverage is 45.0x and the current year is 50.9x. Median net debt to EBITDA is 0.31x and the current year is 0.10x.
Net debt is $19.4B against EBITDA of $193.8B. Interest expense is $3.1B against operating income of $155.2B. Every one of the four readings sits at the 10-point level.
10/10.
The one hump in that line is FY2017 at 2.06x, and it has a name. Microsoft closed the $26.2B all-cash LinkedIn acquisition in December 2016 and financed it largely with new debt. Net debt went from $47.0B to $78.5B in a single year and interest coverage bottomed at 13.2x.
Step 9. Future Growth: does the market expect the compounding to continue?
Yes, and more of it than the business has actually been delivering.
The bar: every forward year gets checked on its own. Revenue at 15% AND EPS at 20% in every single year is a 10. 10% and 15% is an 8. 7% and 10% is a 6. No averaging, no median. One weak year drags the whole category, which is the point of a consistency test.
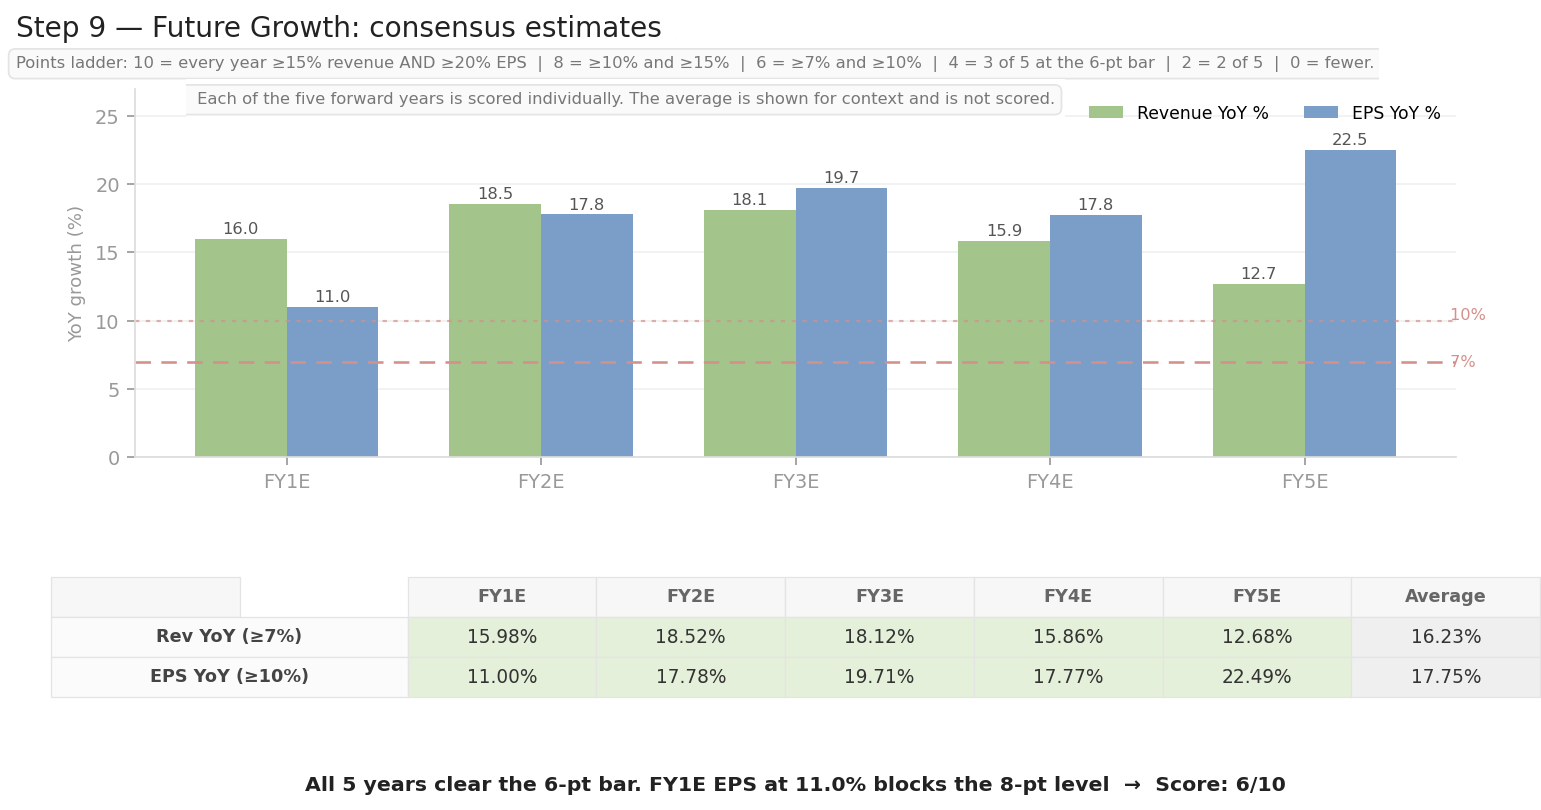
All five years clear the 6-point bar. Four of the five clear the 8-point bar. FY1E EPS at 11.00% is the one that blocks it, since the 8-point level wants 15%, and under this scoring a single miss is enough.
6/10.
Step 10. Predictability: can analysts even model this thing?
Yes, and they’ve got better at it every decade.
The bar: overall beat rate of 95% or better is a 10. 90% is an 8. 80% is a 6. 70% is a 4. I score the lower of the revenue and EPS rates.
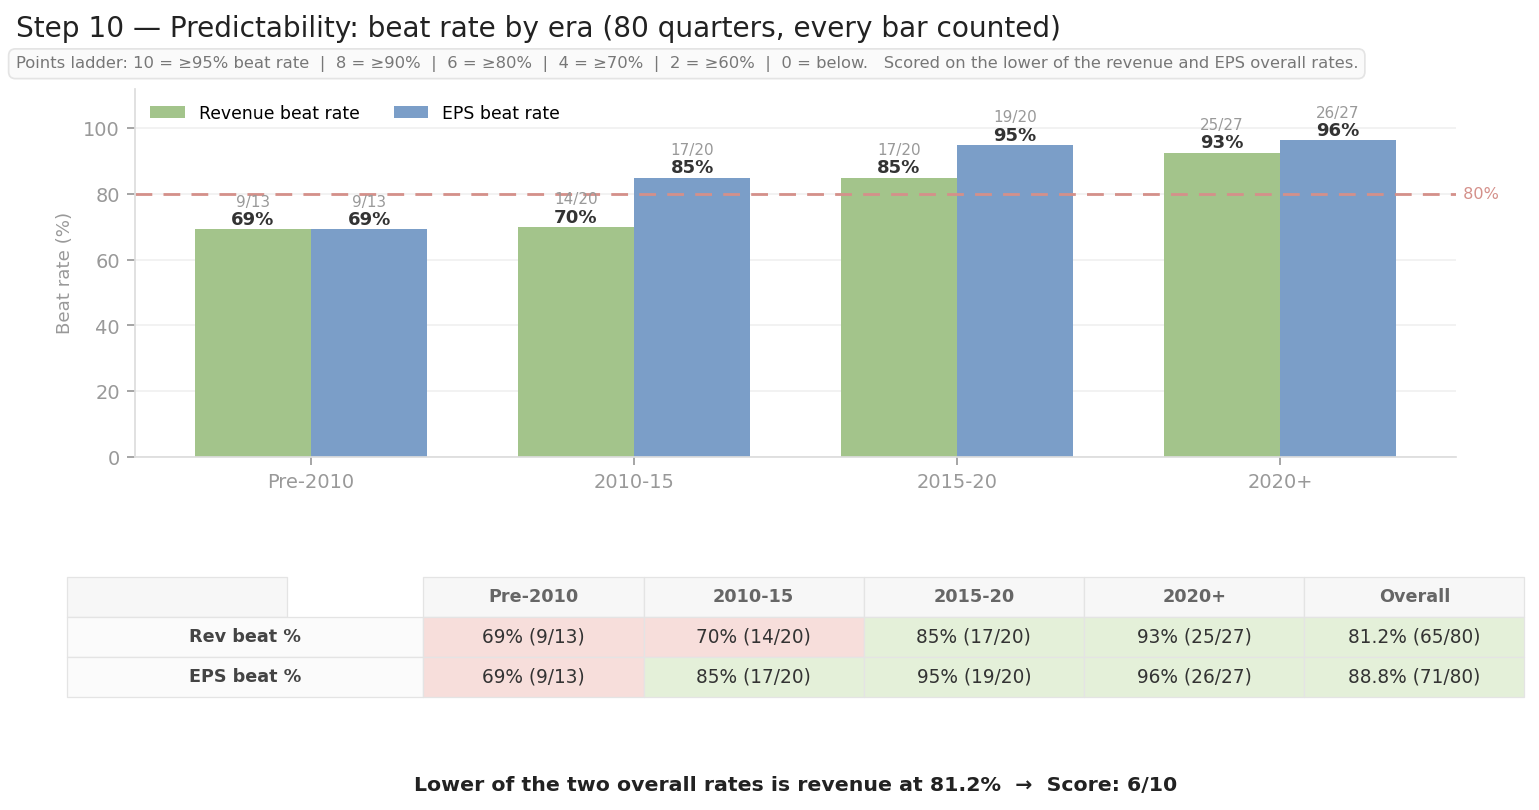
80 quarters, from calendar 2006 to 2026. Nothing excluded, GFC and 2020 included.
Revenue beat in 65 of 80 for 81.2%. EPS beat in 71 of 80 for 88.8%. The lower of the two is revenue, so 81.2% is the scoring number.
6/10.
The era breakdown is where this gets interesting. Revenue beat rate went 69%, then 70%, then 85%, then 93%. Fifteen of the twenty-nine misses in this dataset happened before 2015. Post-2015 the revenue beat rate is 42 of 47, or 89.4%. More subscriptions? Better communication between the management and the analysts? Business becoming more predictable? All?
The Final Score
72 out of 100. A Tier.
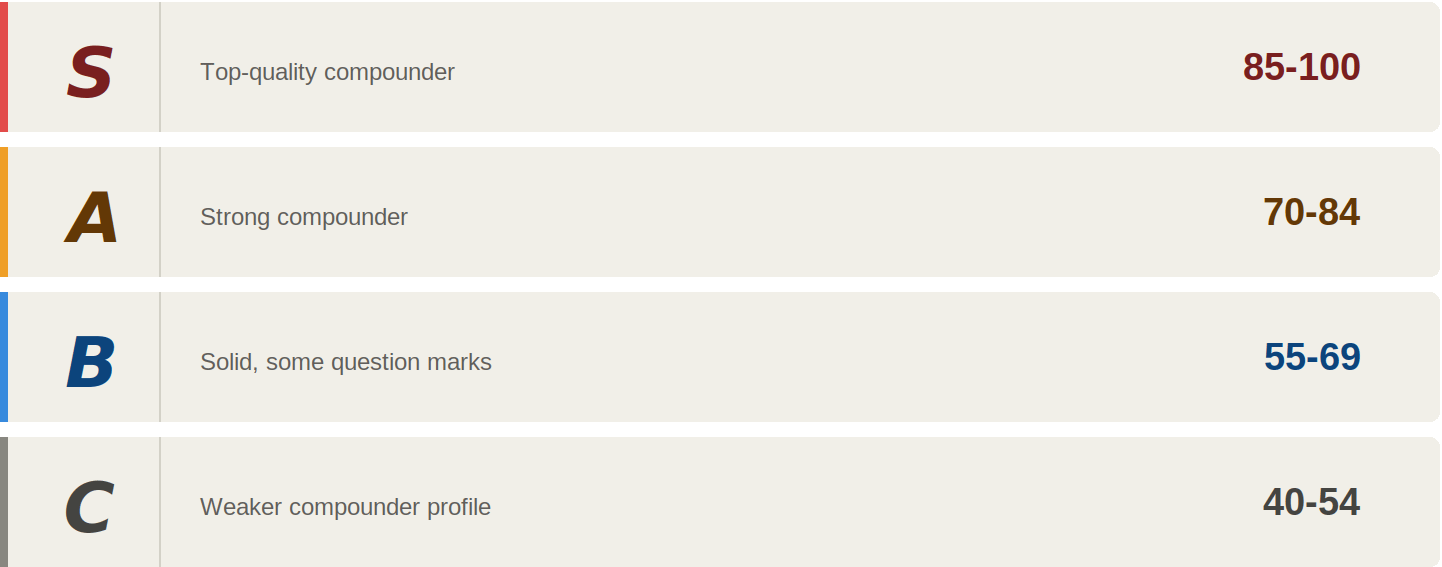
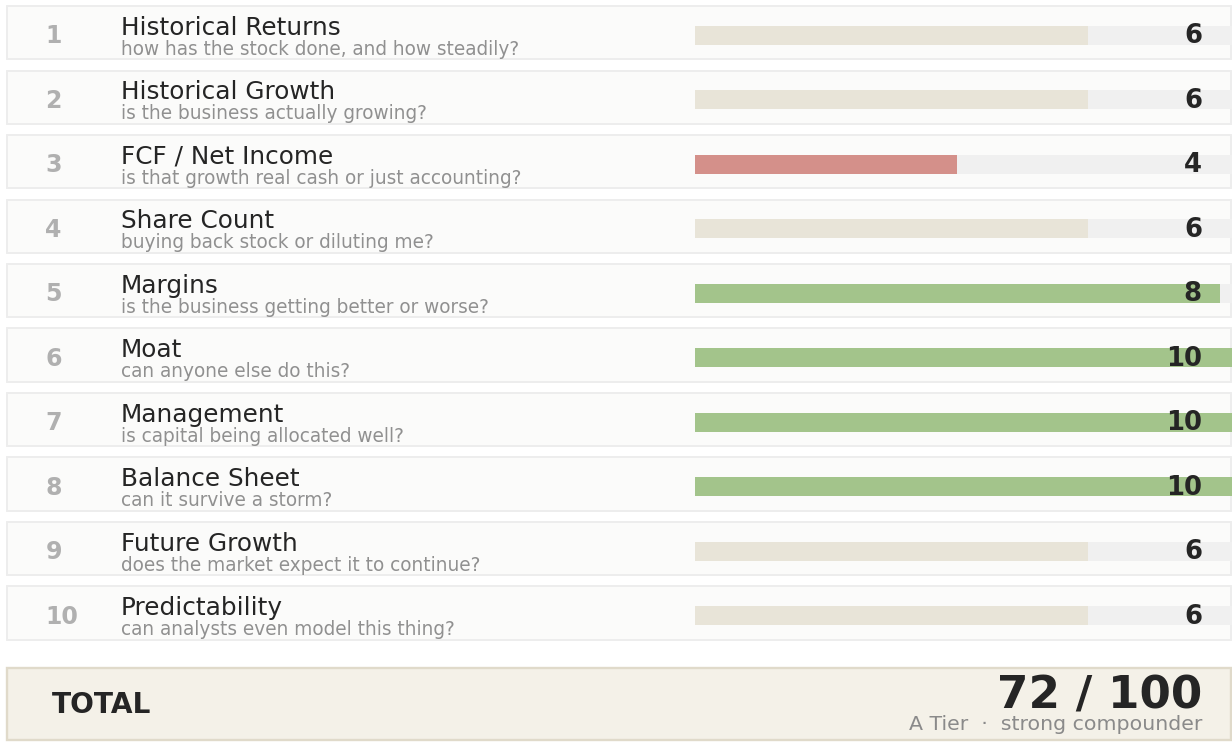
Moat, management and balance sheet all scored a perfect 10, and margins scored an 8. On the questions of whether this is a great business with a defensible position, a fortress balance sheet and people who know what to do with a dollar, Microsoft answers as emphatically as anything I’ve ever run through this thing. Revenue passed every growth check. EPS passed every growth check. Gross margin has been flat within 100bps of its long-run level for a decade while net income margin expanded 650bps above its.
Three categories dragged it, and the same thing caused all three. Step 2 lost five of its eighteen checks on free cash flow. Step 3 dropped to a 4 because FY2026 cash conversion was 50.1%. Step 5 lost its two checks on FCF margin. Capex went from $28.1B to $115.9B in three years and it shows up in every cash-based measure in this report.
Strip the FY2024-26 capex step-up back to the FY2023 run rate and add the 4 points in step 2 and 4 points in step 3. That would make the total score 80. Also, adding the 2 points lost in step 5 takes into the S Tier with 82 points.
It’s an investment-cycle problem. Microsoft is deliberately converting free cash flow into fixed assets at a rate nobody in software has attempted, and the QS is built to notice exactly that and mark it down. This checklist measures every business against an ideal business that goes up and to the right at double-digit rates in everything.
Now, let’s check out the valuation.
What the Market Has Paid

One window, twenty years, and it’s a clean one. EPS went from $1.49 in FY07 to $17.28 in FY26. Two down years in that whole stretch. FY09 was -12% and FY13 was -7%. Everything else was up, and the market handed the stock a 22x average multiple for the trouble.
That 1.58 PEG is the number that matters. It’s what buyers have been willing to pay per point of growth across two decades, a financial crisis and three CEOs.
Today the blended multiple is 26.6x.
Now, let’s see what we can make based on what we assume.
